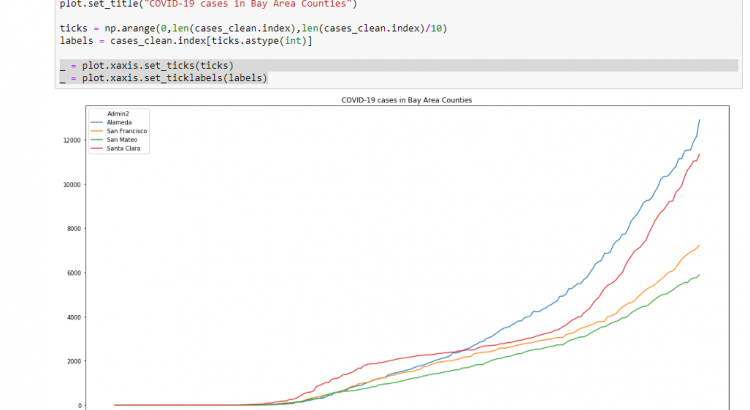
I’ve blogged before about how I’m doing some of my own data analysis on the COVID-19 numbers. One thing that I didn’t like about my graphs was that they didn’t contain an x-axis, which made them a little bit harder to read. In this (very quick) blog post I’ll show you how to add an […]
Tag: covid-19

How I’m doing my own COVID-19 data analysis using Jupyter, Python, Pandas and Matplotlib
Before I start this blog post, let me say this: I’m not a doctor, not a scientist and not a public policy maker. I want to express my support to all of those impacted by COVID-19, and don’t want this blog post to sound soulless. I’m a tech enthusiast, who likes numbers, which is why […]
