I’m a huge fan of GitHub Codespaces. Codespaces deliver a fully powered and customizable Visual Studio Code (VS Code) instance in the browser. I’ve started using Codespaces recently to do my Covid analysis. It’s a great tool because I don’t need to install anything locally, I can simply use Codespaces straight from the browser. Codespaces […]
Tag: python

Changing Azure disk SKUs using Azure Resource Graph and the Azure Python SDK
I was recently working with a customer who needed to make mass changes to Azure disks (we’re talking couple 100 disks). The disks were part of a demo environment that was very infrequently used, but when it was used it needed to perform well. When the demo was spun up, the disks needed to be […]

Adding x-axis to matplotlib plots in Jupyter notebooks
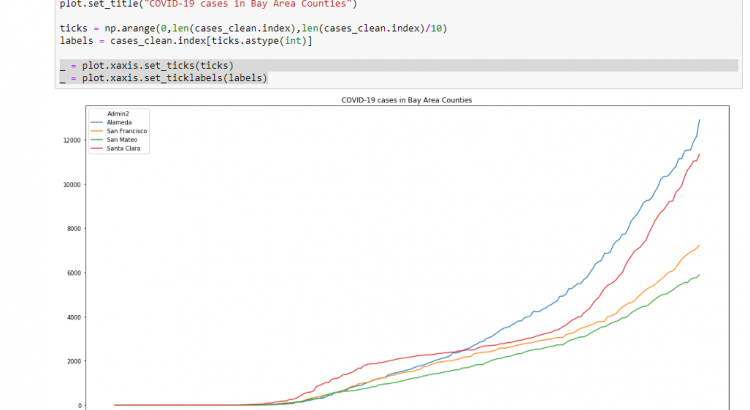
I’ve blogged before about how I’m doing some of my own data analysis on the COVID-19 numbers. One thing that I didn’t like about my graphs was that they didn’t contain an x-axis, which made them a little bit harder to read. In this (very quick) blog post I’ll show you how to add an […]

How I’m doing my own COVID-19 data analysis using Jupyter, Python, Pandas and Matplotlib
Before I start this blog post, let me say this: I’m not a doctor, not a scientist and not a public policy maker. I want to express my support to all of those impacted by COVID-19, and don’t want this blog post to sound soulless. I’m a tech enthusiast, who likes numbers, which is why […]

Confusion matrix, accuracy, recall, precision, false positive rate and F-scores explained
When building a machine learning model, it’s important to measure the results of your model. Typically, you split a dataset into a training dataset and a test dataset. The training dataset is used to train your model, while the test dataset is used to measure the performance of your model. A commonly used method to […]
