I had a conversation today about custom metrics in Azure. I have worked with customers in the past that have streamed custom metrics into Azure Log Analytics to process them.
This was a case where a customer had done more research than me, and had discovered that it’s possible to send custom metrics into Azure Monitor.
Since this was completely foreign to me, I decided to give a spin and try it out.
Setting up a VM to stream custom metrics
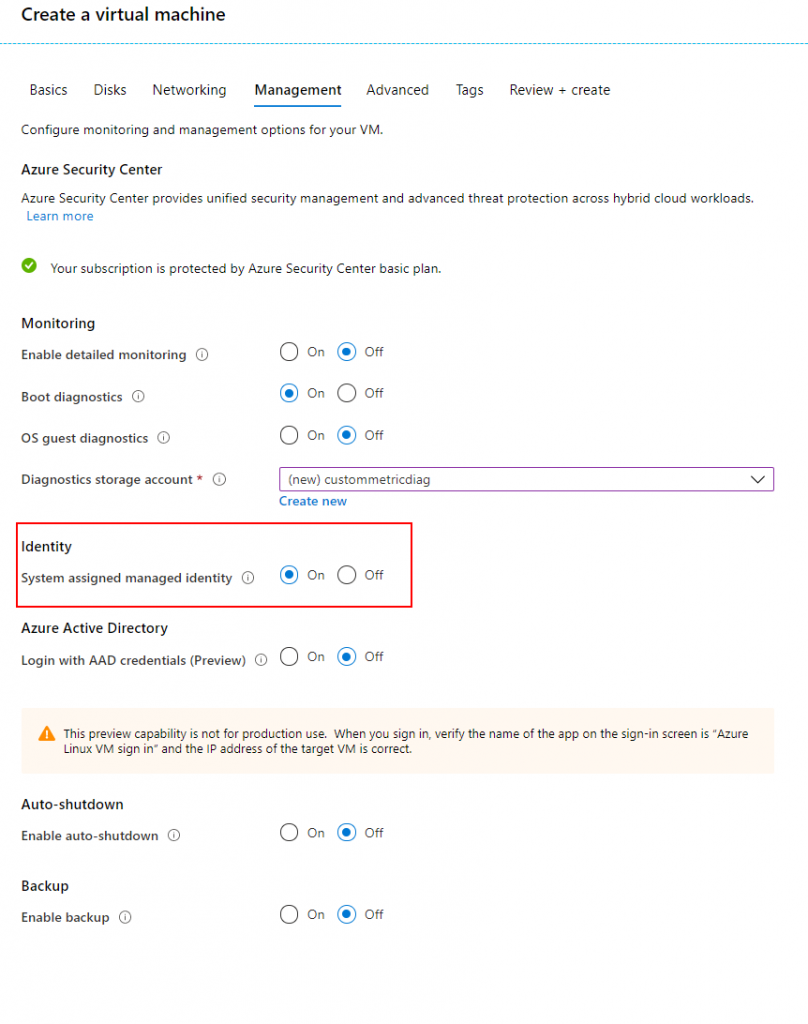
To start of the process, I’ll create a new VM, and assign it a managed identity. I’ll use this managed identity to provide the RBAC role required to stream custom metrics. Using managed identity, I can use the instance metadata service to get a token that I’ll use to send the data.
Once the VM is created (which only took me 23 seconds!!!), we’ll assign the Monitoring Metrics Publisher role to that VM in the IAM blade.
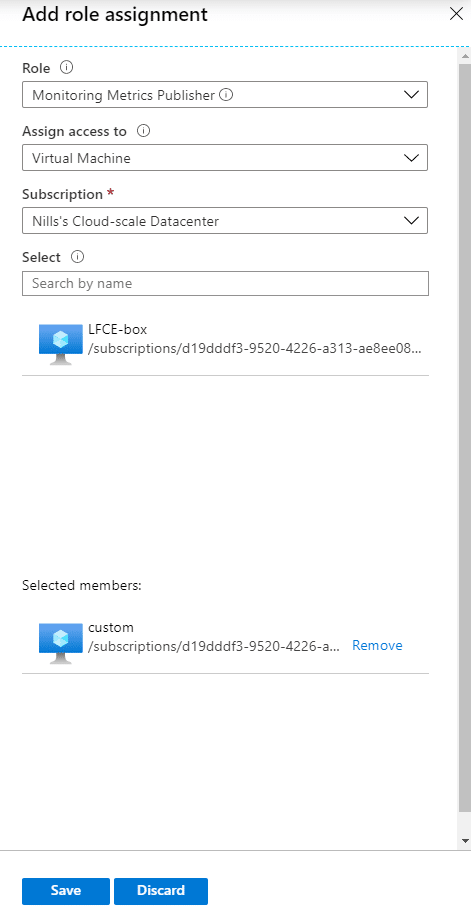
With that done, we should be able to log into to the VM and publish custom metrics.
Sending custom metrics
To send custom metrics, we’ll need to send the metrics to: https://<azureregion>.monitoring.azure.com/<AzureResourceID>/metrics.
We’ll need to be authenticated to access that endpoint, so we’ll tackle that as well. Let’s first get the region information and the resource ID. To get those, we’ll use the Instance Metadata Service.
IMDS=$(curl -H Metadata:true "http://169.254.169.254/metadata/instance?api-version=2019-06-01")
LOCATION=$(echo $IMDS | jq .compute.location | sed -e 's/^"//' -e 's/"$//')
RESOURCEID=$(echo $IMDS | jq .compute.resourceId | sed -e 's/^"//' -e 's/"$//')
Next, we’ll get the authentication token to get from our managed identity.
TOKEN=$(curl 'http://169.254.169.254/metadata/identity/oauth2/token?api-version=2018-02-01&resource=https%3A%2F%2Fmonitoring.azure.com%2F' -H Metadata:true -s | jq .access_token | sed -e 's/^"//' -e 's/"$//')And with that, we should be able to send data to the custom metric. Let’s first construct a custom metric that we’ll want to send. For this, we’ll create a json file with a sample metric.
DATE=$(date -u +"%Y-%m-%dT%H:%M:%S")
echo '{
    "time": "'$DATE'",
    "data": {
        "baseData": {
            "metric": "NillsCustomMetric",
            "namespace": "CustomMetrics",
            "series": [
              {
                "min": 3,
                "max": 20,
                "sum": 28,
                "count": 3
              }
            ]
        }
    }
}' > custom.json
Now that we have our custom metric as a JSON file, we can upload it to the custom metric API.
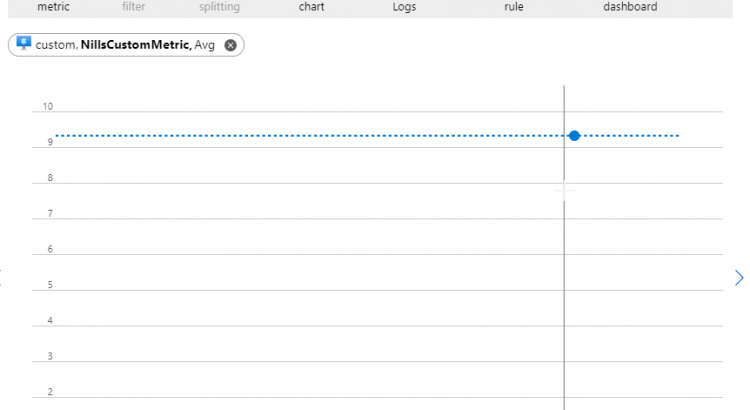
curl -X POST https://$LOCATION.monitoring.azure.com$RESOURCEID/metrics -H "Content-Type: application/json" -H "Authorization: Bearer $TOKEN" -d @custom.jsonAnd then, after giving it a minute, the custom metric shows up:
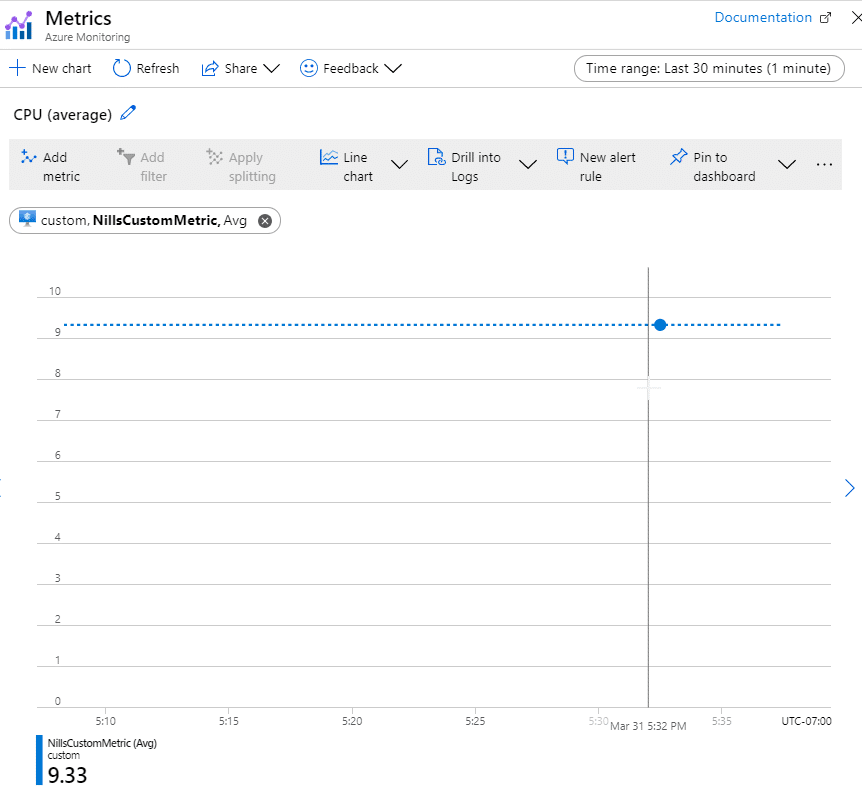
And this wraps up what I wanted to demonstrate.
Summary
As I mentioned in the intro, I wasn’t aware about custom metrics in Azure monitor. I had streamed custom metrics into Log Analytics before, but this seems like a suitable approach as well for metric data. It comes with the Azure dashboarding built-in, and allows you to setup custom alert rules as well based on those metrics.